NARO has developed a technology to decode the waggle (figure-eight) dance of honeybees automatically for estimating the location of flowers used as forage source. This achievement will dramatically accelerate the manual decoding work done so far and useful for efficiently understanding the forage area where European honeybees (Apis mellifera) collect nectar and pollen.
Overview
The honeybees, which are widely used for honey production and pollination of horticultural crops, are famous for conveying the location of attractive floral resources to hive mates by the waggle (figure-eight) dance. The waggle duration represents the distance from hive to the forage site and the waggle direction represents the angle with the sun. In order to decode this dance information for estimating the forage area of honeybees, human observation is necessary, and the manual interpretation is labor-intensive.
Therefore, in this research, we have developed a method to automatically extract and decode waggle information from video recordings taken in field apiaries using a generic camcorder. As a result, it becomes possible to efficiently estimate the forage area of honeybees, and it is possible to understand the honeybee rearing environment throughout seasons. By performing landscape management such as securing flowers and flower-rich habitats within the forage area particularly when food resources are scarce, it helps increase the number of honeybee hive for crop pollination and the production of domestic honey.
The results are published as an article in the international journal on honeybee research "Apidologie" on April 2019
Publication
Satoru Okubo, Aoi Nikkeshi, Chisato S Tanaka, Kiyoshi Kimura, Mikio Yoshiyama, Nobuo Morimoto 2019. Forage area estimation in European honeybees (Apis mellifera) by automatic waggle decoding of videos using a generic camcorder in field apiaries. Apidologie. https://doi.org/10.1007/s13592-019-00638-3
For Inquiries
Contact: http://www.naro.go.jp/english/inquiry/index.html
Reference Information
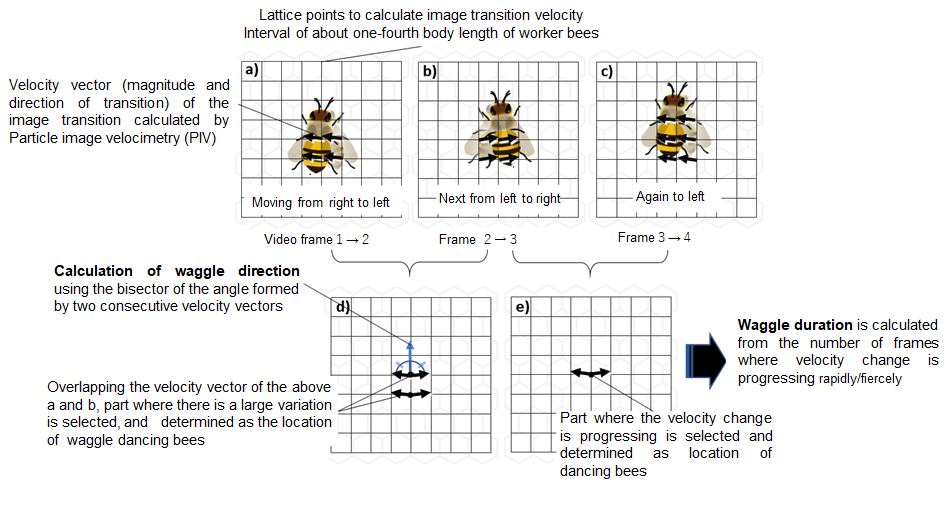
Fig. 1 Schematic outline of the automatic waggle decoding
- Image transition velocity is calculated on the lattice point placed on regular intervals on the image. A typical quality video is about 30 frames per second and since the waggle motion is 10 to 16 reciprocations per second, the body of dancing bee appears to move from right to left and left to right between successive frames of the video(a, b, c)
- Change in velocity vector (magnitude and direction of velocity) calculated between frames are compared (d, e). When the motion of the waggling bees are rapid, the direction of the velocity vector changes significantly, by capturing this large change the waggle candidates can be selected.
- Confirming that the dance candidate appears continuously for more than a fixed time (about 0.5 seconds), identify a series of waggling, and calculate the duration and direction of each waggle run.
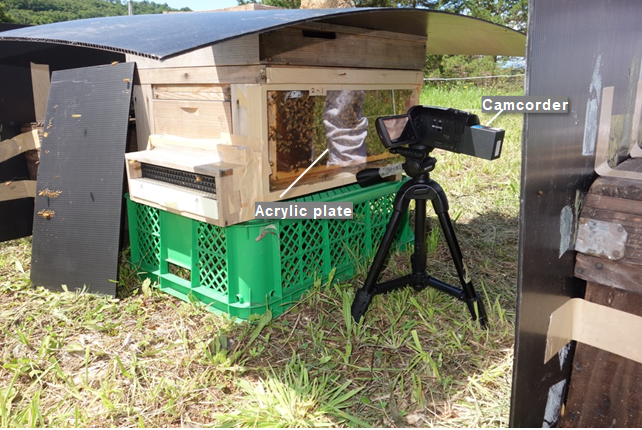
Fig. 2 Video recording using observation hive in an experimental field apiary
On the right side of the hive as seen from the front, the wooden side plate is replaced by a transparent acrylic plate to allow observation of most of the end frame. In addition, the hive gate is restricted to the acrylic plate side to ensure that returning worker bees would pass through this frame to enter the hive. Consequently, most waggle dances occurs on the observable side of this frame. During the video recording the acrylic plate is shielded using black plastic panels so that light does not reflect or direct sunlight enters the hive and disturb the environment inside the hive.
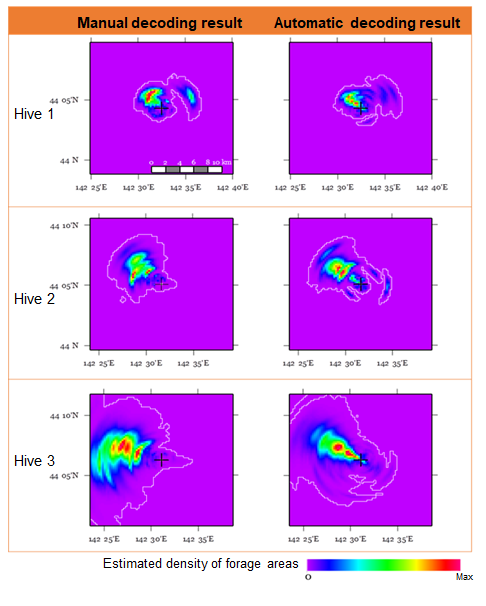
Fig. 3 Estimation result of forage range by automatic and manual decoding
Forage area is shown by estimated density. A density estimation map is created by dividing a 20-km square into cells at 250-m intervals around each apiary (center "+"), where the color change from purple to blue, yellow and red, indicating that the higher possibility of being used as a forage area. The range where the cell value is larger than the median value across all cells in each map was defined as the forage range which is enclosed by a white border.